Shopify Sales Funnel Optimization with Shopify Reports

Shopify sales funnel optimization starts in your own admin: open Analytics > Reports, filter the category to Behavior, and open the Conversion rate breakdown report. It shows how many sessions add to cart, reach checkout and complete it. Find the step with the biggest drop, fix only that step, and measure again.
Report names and definitions come from the Shopify Help Center page on behavior reports, read on October 23, 2026, and A/B testing from Shopify’s Spring ’26 Edition.
Your Shopify sales funnel in four steps
The Conversion rate breakdown report draws your store’s funnel as a chart with four steps, always in this order:
- All sessions
- Sessions with cart additions
- Sessions that reached checkout: sessions with user input, such as a key press or click, during checkout
- Sessions that completed checkout
Each step’s rate is that step’s sessions divided by all sessions. A switch called Open Funnel changes how sessions are counted. In the open funnel, a session counts in a step even if it skipped earlier ones, such as a shopper who used an accelerated checkout button on the product page and skipped the cart. In the closed funnel, a session counts only if it went through the steps in order. Use the closed funnel to find where people drop out; use the open one when many of your orders come through accelerated checkout buttons.
The Conversion rate over time report shows the same steps as columns by day, week or month, and its conversion rate is “the percentage of sessions that resulted in a purchase”.
Read the Conversion rate breakdown report
- Go to Analytics > Reports, click the Category filter and choose Behavior.
- Open Conversion rate breakdown and set the date range to the last 30 days.
- Turn on the comparison with the previous period, to see whether a step got worse recently.
- Filter out bot sessions with the human or bot session filter. Bot sessions inflate “all sessions”, the base of every step’s rate, and make all the later steps look worse than they are.
- Write down the drop between each pair of steps. The pair with the biggest drop is where you start.
Two dates matter when you compare periods. Session-based data in Shopify only goes back to October 1, 2022. And Shopify changed how sessions are measured between 21 and September 23, 2026, so conversion rates before and after that date are not directly comparable. Our Shopify analytics guide explains that change.
You can also ask Sidekick in the admin about your sessions and conversion, for example “Show my conversion rate by device type for the last 30 days”.
Fix the step that leaks
| Biggest drop | What it usually means | What to check and change | Where in Shopify |
|---|---|---|---|
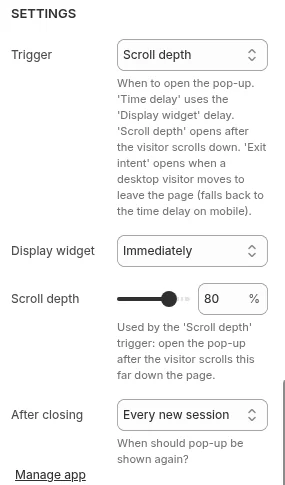
| From all sessions to cart additions | Visitors do not find a reason to buy, or the wrong visitors arrive | Landing pages of paid traffic; product photos and price shown above the fold; delivery cost and time near the price; reviews; a discount in exchange for an email. Our app Pop Up Discount shows a popup by time on page, scroll depth or exit intent that trades a discount code for the visitor’s email, and Shopify Flow sends the code | Products, theme editor, marketing reports in Analytics > Reports |
| From cart additions to reached checkout | Something in the cart puts people off | Shipping cost revealed only in the cart; no clear checkout button on mobile; a sign-in step before checkout | Shipping and delivery settings, theme cart settings, customer account settings |
| From reached checkout to completed checkout | Friction or surprise at payment | Payment methods your customers expect; unexpected taxes or duties; long forms; a discount field that invites code hunting | Checkout settings, payments |
| All steps low on mobile only | Layout or speed problem on phones | Test the whole path on a real phone; check web performance reports | Web performance reports, theme |
Pick fixes from one row only. If the drop is between reached checkout and completed checkout, a new homepage banner will not help, and if it is at the first step, checkout tweaks will not either. The checkout row has its own guide: Shopify checkout optimization. Carts left at the second step are the audience for abandoned cart recovery emails.
We measure our own apps’ funnel the same way, from site visit to App Store listing to install to paid plan, and we change one step at a time.
Test the fix before you keep it
Shopify’s Rollouts tool, as described in the Spring ’26 Edition, publishes a new theme, checkout configuration or customer accounts setup at a scheduled time or as an A/B test. Use it for changes you can test, such as a new product page layout against the old one:
- Change one thing per test, on the step you identified.
- Run it long enough to see enough orders in each version; on a small store that can mean weeks.
- Compare the step’s rate for each version, not only total sales, which move with traffic.
Changes that cannot be split, such as a new shipping price, can be compared month against month in Conversion rate over time, with a note of the date you changed them. Other conversion topics start at the running a store hub.
What wastes a funnel fix
- Buying more traffic while the cart-to-checkout step loses most visitors.
- Changing five things at once, so you never learn which one worked.
- Comparing conversion rates across the September 2026 session change.
- Using another store’s “average conversion rate” as your target. Compare your store with its own last period.
Frequently asked questions
What is a Shopify sales funnel? It is the path from a visit to an order: all sessions, sessions with cart additions, sessions that reached checkout and sessions that completed checkout. Shopify shows it in the Conversion rate breakdown report under Analytics > Reports.
Where do I see funnel data in Shopify? Go to Analytics > Reports, filter the category to Behavior, and open Conversion rate breakdown for the funnel chart or Conversion rate over time for the same steps by day, week or month.
What is a good conversion rate on Shopify? The Help Center page on these reports gives no benchmark, and the averages we found quoted online had no source. Your own store’s previous period is the useful comparison: if a step’s rate improves after a change, the change worked.